Innovation is no longer optional for organizations today.
Capital is fleeing to the innovators, leaving the laggards behind. If you compare the “innovation premium” – an organizations’ market capitalization divided over its revenue of innovation – you’ll find there’s quite a gap between leaders vs. laggards in any given sector. Innovative companies such as Tesla enjoy a massive “innovation premium” over their legacy competitors such as Ford.
Yet at the same time, the field of innovation management is still in its infancy. As other business fields such as marketing or supply chain have matured, they have been increasingly expected to use data for decision-making. Practitioners in these fields have also become expert at using data to demonstrate the ROI of their programs. We expect to see and are seeing innovation management following this developmental path toward a more data-driven approach.
If you’re like most innovation leaders, you likely want to know:
• How to lead the innovation ROI conversation vs being a victim of it
• What innovation metrics should you measure; and,
• What does “good” look like?
Recently, Suzan Briganti and Mary Ann Bianco hosted a live session as part of Innov8rs Connect, diving into these questions, sharing how to use data for better innovation decision-making and planning, and to prove the success of your innovation programs with solid ROI metrics.
Suzan represents the United States on ISO 56,000, the International Standards Organization for Innovation Management. She is the founder of Swarm Vision, a Silicon Valley predictive analytics company focused on innovation management. Mary Ann Bianco is former VP of Customer Success at Oracle, where she led billion dollar enterprise accounts, helping them use data to demonstrate the ROI of Oracle software. Mary Ann supports Swarm’s enterprise software customers.
Below you’ll find a summary of their session.
Leading the Innovation ROI Conversation
Innovation leaders who lack either the knowledge of innovation measurement or lack good numbers may initially be tempted to dodge the ROI conversation. But again and again, we see that leaders who preempt the question, “What results have you produced from all of this innovation investment?” are in a better position than leaders who indulge the belief that innovation can’t be measured, or that soft metrics are good enough.
Innovation executives who lead the ROI conversation get consistent, if not growing budgets, and enjoy longer tenure in their roles. More time and more budget only enable them to build stronger and stronger results. It’s a virtuous circle.
The quality of your measurements will make or break you. The International Organization for Standardization (ISO) recommends that:
“Organizations should select SMART indicators that are Specific, Measurable, Actionable, Realistic, and Time-related.”
– ISO 56,008 draft standard.
Vague measures like “more” or “better” don’t help if you fail to define what they mean, how they will be measured, and what the baseline is.
A Sequence of Measurements
As any innovation leader knows, it takes time to get an innovation to market. In fast moving consumer goods, the norm we see is about three years from idea to market. But it can take much longer in highly regulated industries, or where the innovation relies on basic research, and for transformational innovations. The savvy innovation leader knows that the elapsed time between idea and market results cannot be left a gaping void.
A sequence of measurements is needed to show the flow from Leading Indicators to Key Performance Indicators (KPIs) to Lagging Indicators (e.g. 20% growth in sales and profits).
Do the Math
As difficult as it can be, you need to nail down the desired business outcomes in numbers, and set up a method to measure progress. Many large organizations track their percent of revenue or profits coming from new products (e.g. new in the past 3-5 years). They may further measure revenue or profits coming from new products by innovation horizon, e.g.: What percent of these new products are incremental vs. transformational innovations?
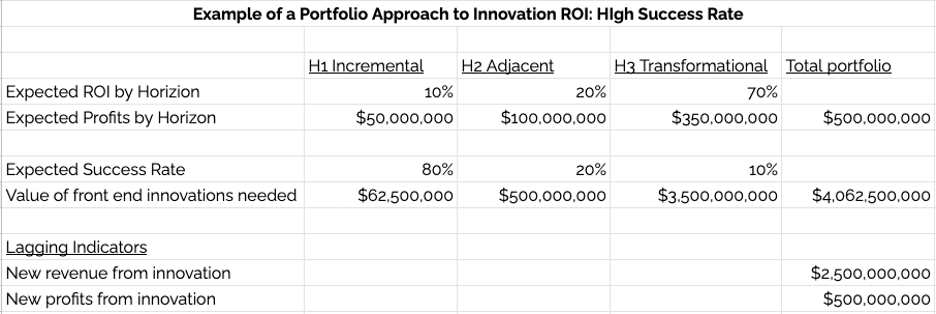
A healthy balance in your innovation portfolio is key. While the risk involved in incremental innovations may be lower, so is the ROI. Harvard Business Review reports that Core (or incremental) innovations typically generate about 10 percent of your innovation ROI, adjacent innovations contribute 20 percent, whereas transformational innovations typically generate about 70 percent of your innovation ROI. Clearly, if your leaders want higher growth and ROI, they need to take more swings at transformational innovations.
Let’s use the example of a $50B company wanting to grow revenues by 10% or $5B per year. They assign half of this revenue growth goal to innovation, or $2.5B. Assuming a high success rate of 80% for incremental innovations, 20% for adjacent and 10% for transformational, they will need about $4B in innovations in their pipeline to deliver $2.5B in increased revenues:
What if we assume a more modest success rate of 80% for incremental innovations, 10% for adjacent and 3% for transformational? In this case the company will need a much larger sum of $12.7B in innovations in their pipeline to deliver $2.5B in increased revenues:
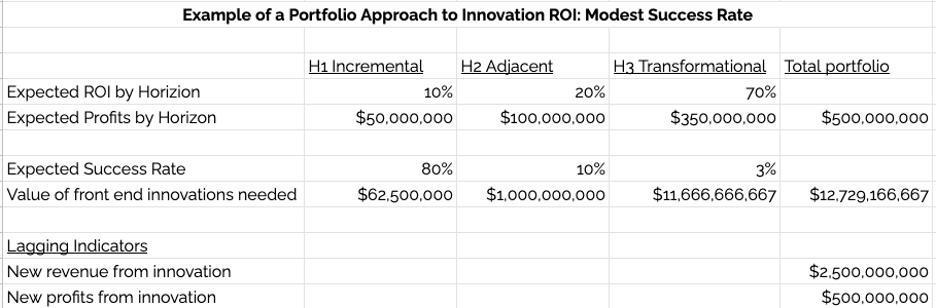
Sketching out these assumptions for your C-suite will be a “reality check” for them on their ROI expectations. If they’re not willing to support the risk involved in Transformational projects, they should not expect a 70% ROI from innovation, either. Having these metrics spelled out in simple math provides a rational framework for decision-making, which is a much healthier way to operate than mere “hand-waving” and opinions.
What to Measure: Look Beyond Projects and Pipeline
So what do leading innovative organizations measure? Most organizations focus too much on projects. Less sophisticated leaders may also give lip service to the innovation culture while not actively managing it. Many tend to overlook the importance of innovation talent in their workforce or on their teams. This is just magical thinking.
Is there any other field you can think of where talent is not understood to be a key predictor of success? Can you imagine putting together a winning football team where players are not selected for their talent, and where that talent is not ardently and systematically developed? Or where the culture of the football club is not a major focus for its coaches and managers? Not very likely!
Many studies have found clear links between innovation talent, teams, culture and profits.
According to BCG, talent and teams are critical leading indicators of innovation ROI: 3x higher innovation output as a percent of sales is experienced by innovation leaders who prioritize assigning their best talent to innovation.
Gallup found that high performing teams increase profitability by 23%; and increase sales productivity by 18%
According to Deloitte, organizations with a strong learning culture are:
92% more likely to develop novel products and processes
52% more productive
56% more likely to be the first to market with their products and services; and,
17% more profitable than their peers.
And the Aberdeen Group found that companies that utilized talent assessments experienced a “2.5 times greater year-over-year increase in profit per full-time equivalent” compared to companies that did not use talent assessments.
Clearly an exclusive focus on projects – overlooking the huge impact of talent, teams and culture on profits – is not the winning strategy.
Understanding there is more to Innovation ROI than projects, savvy innovation leaders look at six elements: Individuals, Teams, Projects, Pipeline, Innovation Culture and Innovation System, inter-operating as predictors of Innovation ROI.
Here are brief descriptions of the six key components for measuring innovation:
- Individuals — Do employees and leadership possess the talent and skills for the kinds of innovation the organization wants to produce?
- Teams — Do teams possess the talent, skills and resources for these kinds of innovation?
- Projects — Do you have the number and quality of projects needed to meet your end goals?
- Pipeline — How much time does it take to move from one stage gate to the next? Are data-driven decisions being made at these gates? Are decisions transparent and communicated to the workforce?
- Organization’s culture — Does the culture support or fight innovation behaviors? Do leaders “talk” one way and “walk” the other?
- Innovation systems — Does the innovation system (governance and process) promote the kinds of proposals the organization seeks? Is sufficient budget and leadership being given to innovation day-to-day?
While leading organizations address all six of the measures above, they tend to have a specific focus, as well. A repeated theme among leading organizations, whether for profit or government agencies, is they want to get better at adjacent and transformational innovation (H2 and H3). They feel they have pretty much mastered continuous improvement, and have a good success rate at incremental innovation. But they either don’t have enough H2-H3 ideas, or their failure rate is too high. They also want to see more transformational projects moving faster through stage gates. And overall, they want to see more proposals being funded by business units (sometimes called the “infusion rate”).
Interestingly, leading innovative organizations now also want to have a more innovative workforce. They want to identify and retain their high potential innovators. They want to match their people better to the right projects and teams. In fact, today, innovation is becoming inseparable from workforce transformation. More and more innovation leaders are assessing innovation talent and using that data for job and team assignments and in overall organization design.
What Leading Indicators Should You Use?
Once you have agreed on the ROI targets, how do you know if you’re getting there? Most companies measure the outputs (Lagging Indicators). But as mentioned above, you need also establish Leading Indicators and Mid-Stream KPIs to measure progress. The beauty of this approach is two-fold:
- It gives you something tangible to report while ideas are moving through the funnel to market.
- It allows you to diagnose and address problems before they lead to shortfalls in business ROI.
Leading indicators can include:
- The % of your workforce assessed on their innovation skills
- Baseline innovation skill scores of individuals, leaders and teams
- High potential innovators identified and engaged in innovation projects
- % of workforce trained on innovation skills and concepts
- Baseline innovation culture scores
- How mentally diverse are innovation teams?
- What is the churn rate of your high potential innovators?
- Employee and manager perceptions of the innovation culture.
- Goals for improving individual and team innovation skills, and culture by years 1, 2, 3.
Mid-stream KPIs can include:
- Having a highly innovative workforce (scoring in the top two quartiles on innovation scores)
- % of employee proposals by innovation horizon (incremental, adjacent, transformational)
- How does this mix flow into the portfolio plan? e.g. If there are only incremental proposals, you may not meet your ROI goal.
- What % of proposals are being funded by the business units?
- How much time does it take an idea to move through the stage gates to market?
- What is the success rate of ideas through each stage gate?
- What is the survival rate of innovations in market after 1, 3, 5 years?
Ultimate Business ROI
For commercial organizations:
– Increased revenue and profits are common ROI targets
– If publicly traded, a common goal is increased market cap (the total value of the firm’s stock).
For public organizations:
– More transformational innovations crossing the chasm from Research & Development into programs.
– Mission-Impact: How have the innovations served public agency mandates, whether that is increased health of the population, or mapping the universe?
What Does a Good Innovation ROI Look Like?
At this point, you know how to lead the conversation around innovation ROI. You understand the six elements to measure, and the three types of metrics. So, what does good look like?
As background, Swarm research found that innovation talent predicts business results. Swarm assesses the innovation talent in your organization with 99% reliability. They find that on average, 20% of employees in large yet slow-growing organizations are highly innovative, and as such, these organizations are sitting on a priceless talent resource.
However, faster-growing companies of the same size tend to have 40% of highly innovative employees, which is double the amount compared to the slow growers. Swarm helps to close that gap significantly. Through its innovation talent and culture assessments, Swarm customers hire and retain more innovative employees. Through Swarm innovation training, employees develop their innovations skills by 15–30% in less than three months.
Customers who use Swarm have seen stunning improvements in their innovation ROI. They double their workforce’s innovation skills. They improve their innovation culture by 20% in one year. They consistently generate $1B proposals, which are funded at 3x the rate vs. prior to Swarm. And Swarm innovation projects’ time to market has been reduced from 36 to 18 months.
This is what good looks like.
Swarm Vision is the predictive analytics company from Silicon Valley that brings a fresh, data-driven approach to corporate innovation. Swarm drives rapid growth in mid-to-large sized organizations through innovation with the workforce you already have. Swarm is proud to serve Fortune 500 companies and federal agencies, and was named HR Tech Product of the Year in 2018.
If you’re keen to improve your organization’s innovation ROI, learn more about Swarm Vision here or contact them via Inquiry@SwarmVision.com.